The most dangerous lies in your business are the ones you're telling yourself
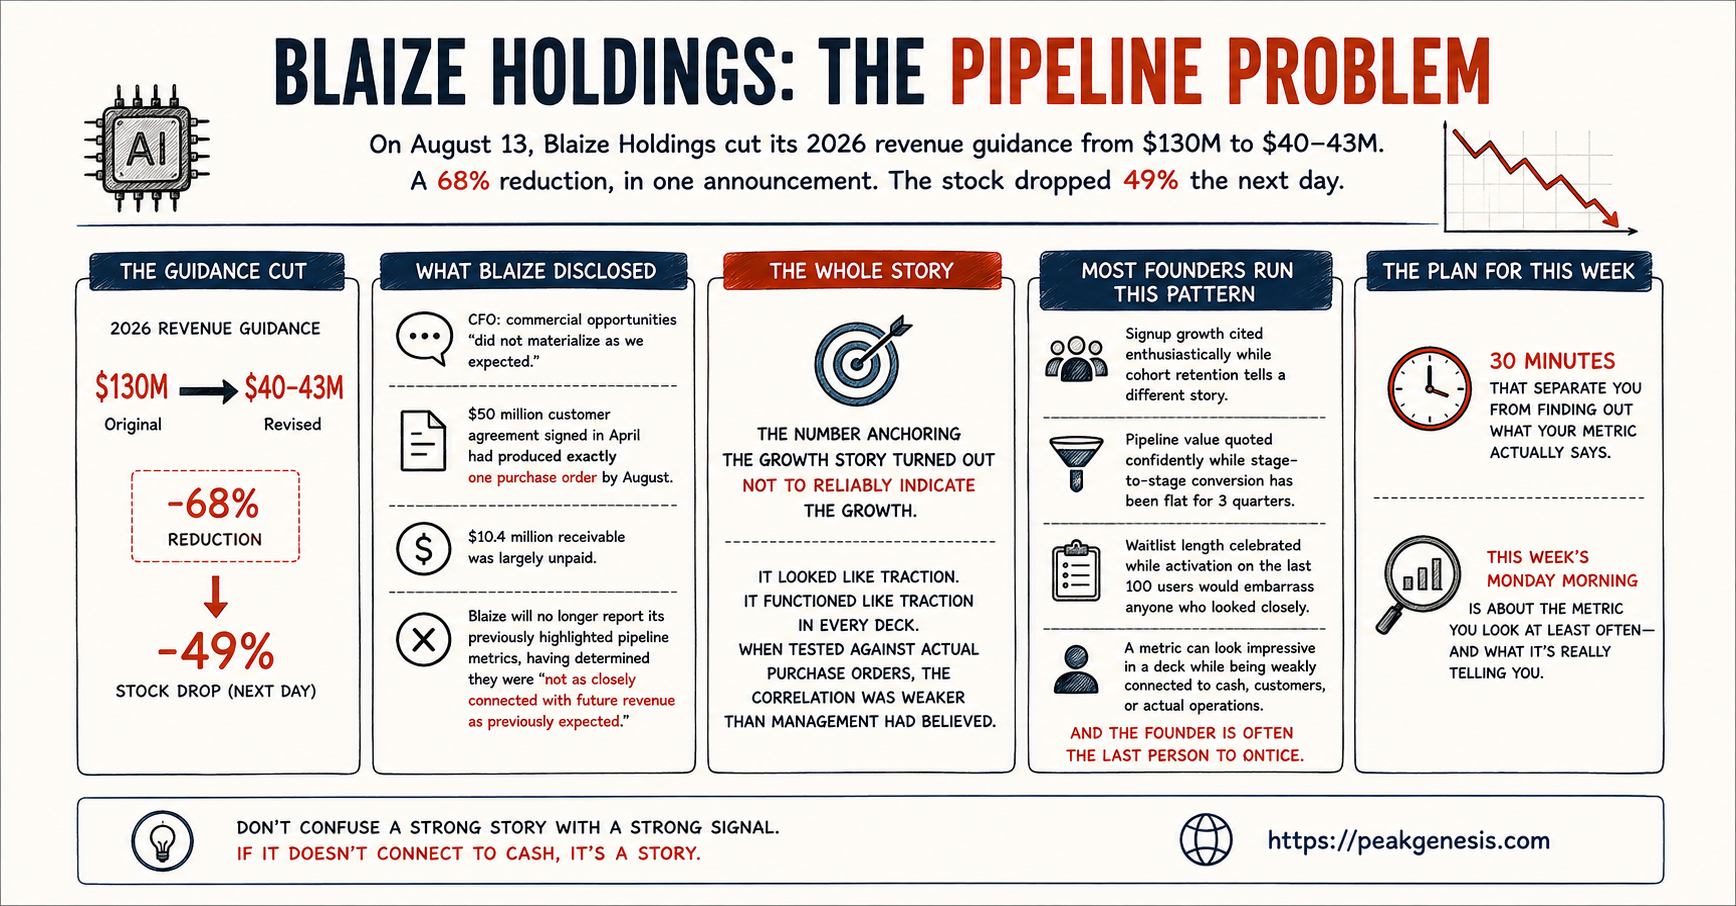
On August 13, an AI chip company called Blaize Holdings cut its 2026 revenue guidance from $130 million to $40 to $43 million. A 68% reduction, in one announcement, from a company whose stock had listed publicly in May. The shares fell 49% the next day, trading below $0.64 against a May offering price several multiples higher. The specifics inside the announcement are the part worth sitting with. The CFO said several commercial opportunities "did not materialize as we expected" and that the company had planned on "a regular cadence of purchase orders from customers already under contract." A $50 million agreement with one customer, signed in April and described as key momentum, had produced exactly one purchase order for $13.7 million by August. Another $10.4 million receivable was largely unpaid.
The number that looked like traction
Then came the line that contains the whole newsletter: Blaize announced it would no longer report its previously highlighted pipeline metrics, having determined they were "not as closely connected with future revenue as previously expected."
Translation: the number that had been anchoring the growth story turned out not to be a reliable indicator of the growth. It looked like traction. It functioned like traction in every deck and every earnings call. When actual purchase orders were tested against it, the correlation was weaker than management had believed.
There is a version of your business that lives in your deck. There is a version that lives in your operations. The gap between them is where the real risk quietly accumulates.
The founder's preferred interpretation
Most founders are not committing anything close to what Blaize is being investigated for. But most founders are running some version of the same underlying pattern: presenting a metric that supports the growth story while the metrics that would contradict it stay in a separate mental folder marked "context," "temporary," or "not the full picture."
Signup growth reported enthusiastically while cohort retention sends a different message every month. Pipeline value cited confidently while the actual conversion rate from stage two to stage four has been flat for three quarters. Waitlist length celebrated while the activation rate on the last hundred users would embarrass anyone who looked at it closely.
None of this is dishonesty in the ordinary sense. It is the more common thing: management's preferred interpretation of the data crowding out the more sober one, because the preferred version is easier to talk about with investors and easier to hold onto internally when the week has been hard.
The uncomfortable truth Blaize's disclosure surfaces is that a metric can look impressive in a deck while being weakly connected to cash, customers, or actual operations. And the founder is often the last person to notice this, because the founder is the person with the strongest incentive to believe the connection is stronger than it is.
Contradictory data is the most valuable data
Getting close to reality means treating the data that contradicts your thesis as the most valuable data you have, not the most inconvenient.
That reframe is harder than it sounds. Contradictory data usually arrives quietly, in the form of a metric that has not moved the way you expected or a customer conversation that went differently than you would have predicted. The temptation to file it as noise, a one-off, or something that will resolve next quarter is enormous.
The discipline of instead treating it as signal is what separates founders who course-correct early from founders who course-correct at $0.64 a share.
Before next Monday
Pull up the one metric you look at least often. Spend 30 minutes with it this week.
Ask: if this were the most important thing about my business, what would I do differently? Then decide honestly whether this metric deserves more of your attention than you have been giving it.
Blaize spent months describing pipeline momentum before publicly admitting the pipeline was not predicting the revenue. Your version of that admission is available to you now, in private, before it becomes the version that gets announced.
Monday Morning lands every week. One pattern. One shift. One thing to do before Friday.
Which of your current metrics actually predict what happens next in your business? The free PMF assessment starts there.
Score your own PMF in 50 minutes.
Get a free PMF score across market, founder, and execution readiness, with named gaps and first actions.
Get Your Free PMF Score